Collision diagrams made with My Traffic Sketch
Every diagram below was drawn with this site's own editor — the same free tool you can open right now. For each one: the scenario, why each element sits where it does, what the diagram communicates, and just as important, what it does not prove. All plates, positions and distances are fictional and illustrative.
Rear-end collision approaching a signal
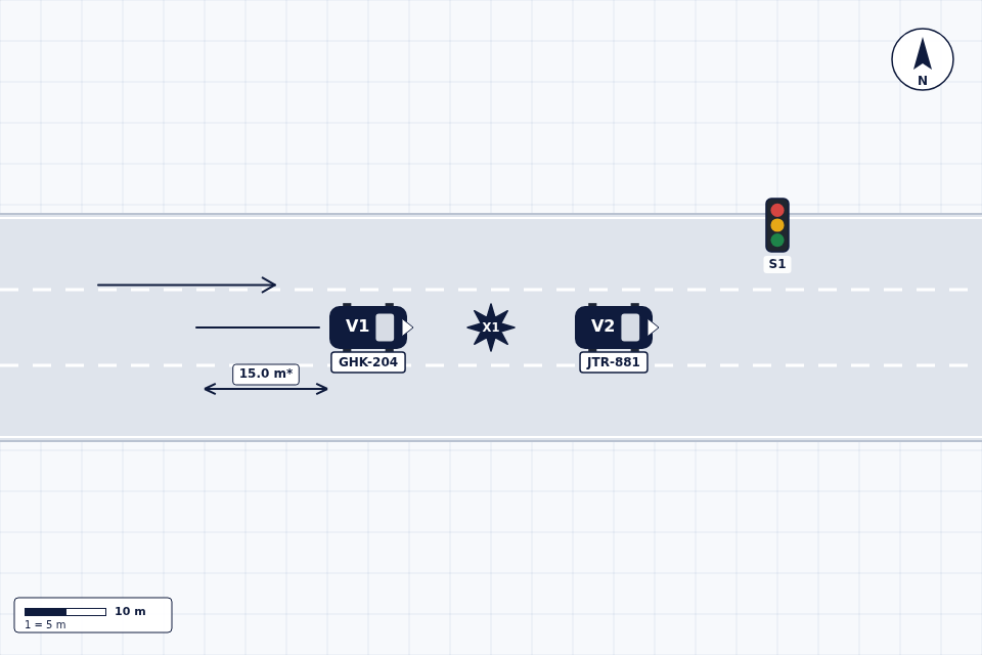
V1 (GHK-204) travels along a one-way road toward a traffic signal where V2 (JTR-881) is stopped. V1 brakes late; the impact point X1 sits between V1's front and V2's rear.
How it was built
- ▸The skid line starts behind V1 and ends at its rear wheels — braking evidence belongs where it was found, not where it looks tidy.
- ▸The 15.0 m measurement records the skid length below the lane, so the number reads without covering the mark itself.
- ▸The signal (S1) is drawn because it explains why V2 was stopped. Context elements earn their place by mattering.
- ▸One travel arrow for V1. V2 gets none — it was stationary, and a missing arrow says so.
What this diagram communicates
That V2 was stopped at a signal, that V1 approached in the same lane and braked before impact, and how long the braking mark was.
What it does not prove
It does not establish V1's speed, following distance before braking, or why V1 braked late. The 15.0 m value is illustrative — a real diagram records the distance you actually measured.
Read the full guide: Rear-end collision diagram: a worked example →Draw this yourself in the editor →
Four-way intersection with a measured approach
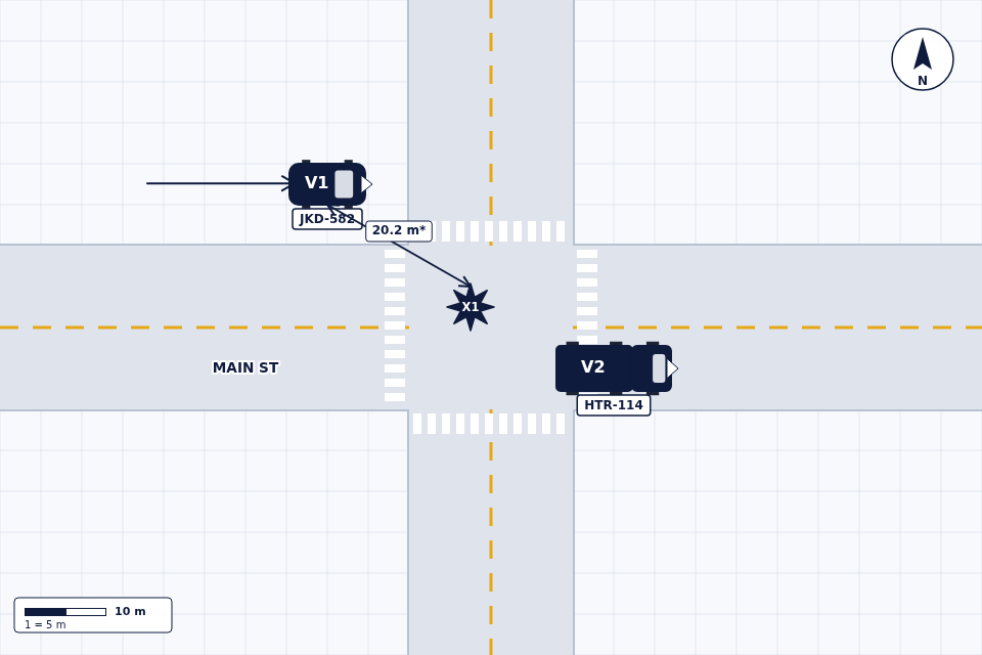
V1 (JKD-582) approaches a four-way intersection on Main St; V2 (HTR-114), a longer vehicle, is on the cross flow. They meet at X1 near the middle of the intersection.
How it was built
- ▸The street name label (MAIN ST) anchors the drawing to the real location — anyone who knows the corner recognizes it instantly.
- ▸V1 is drawn at its pre-impact position with its travel arrow, and a 20.2 m dimension line connects that position to X1 — distance from a known point to the impact is usually the first number anyone asks for.
- ▸Crosswalks come from the intersection template, which silently documents where pedestrians could legally be.
- ▸The impact star sits mid-intersection, not on either vehicle — the point of impact is a place, not a car part.
What this diagram communicates
Which street each vehicle was on, where in the intersection they met, and how far V1's pre-impact position was from the impact point.
What it does not prove
Right of way and the signal state are outside what a diagram can show; both belong in the narrative, with the source of each stated. The 20.2 m value is illustrative.
Read the full guide: Intersection accident diagram: a worked example →Draw this yourself in the editor →
Left turn across a motorcycle's path
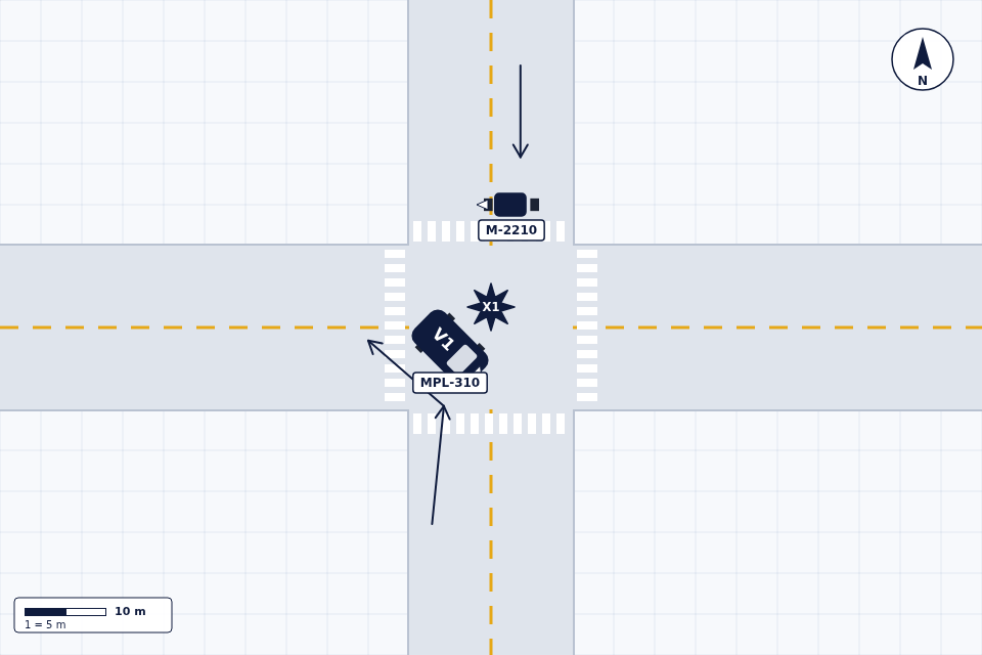
At a four-way intersection, motorcycle M-2210 travels south. Car V1 (MPL-310) turns left across its path; they collide at X1 inside the intersection.
How it was built
- ▸The motorcycle's arrow is drawn behind it, along its actual path — an arrow attached to a vehicle is that vehicle's testimony.
- ▸V1's turn is shown as a path, not a single arrow: the route it followed from its lane into the turn, ending at the impact.
- ▸V1's rotation (about 45°) matters as much as its position — a car drawn mid-turn tells a different story than one drawn square in a lane.
- ▸X1 sits where the two paths cross, which is the whole point of drawing both paths.
What this diagram communicates
Who was moving in which direction, that V1 was mid-turn at impact, and exactly where the two paths crossed.
What it does not prove
Speed, whether the motorcycle was visible in time and who should have yielded are all beyond what the drawing can settle. Direction is what this diagram documents; fault is not.
Read the full guide: How to show vehicle direction of travel in an accident diagram →Draw this yourself in the editor →
T-intersection: left turn from the side street
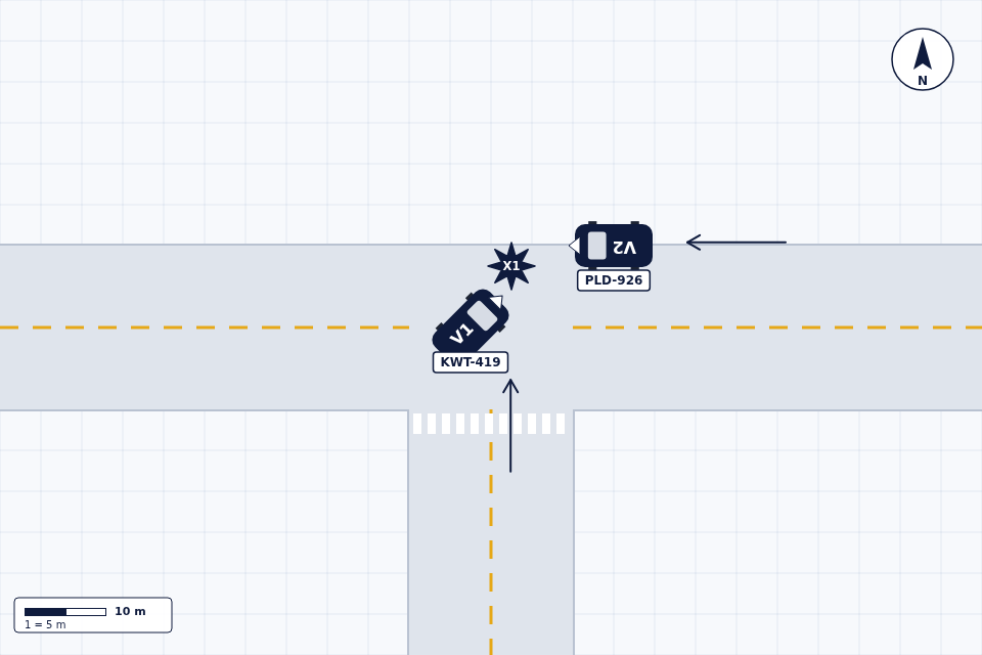
V1 (KWT-419) pulls out of the stem of a T-intersection turning left. V2 (PLD-926) approaches from the east on the main road. They collide at X1 in the westbound half, with V1 mid-turn.
How it was built
- ▸V1's arrow starts in the stem and points into the intersection — the maneuver reads even before you notice V1's angle.
- ▸V1 is rotated mid-turn, nose already across the center line: exactly the moment of impact, not before, not after.
- ▸V2's arrow shows it was through traffic with somewhere to be — approaching from the direction a left-turning driver must check last.
- ▸The crosswalk across the stem comes from the template and marks where the side street ends and the maneuver began.
What this diagram communicates
That V1 was emerging from the side street mid-turn, that V2 was through traffic on the main road, and where in the roadway the two met.
What it does not prove
It does not establish whether V1 stopped before pulling out, V2's speed, or sight lines from the stem. Those belong in the narrative and in photos taken from the driver's position.
Read the full guide: How to draw a traffic accident diagram, step by step →Draw this yourself in the editor →
Lane-change sideswipe on a divided highway
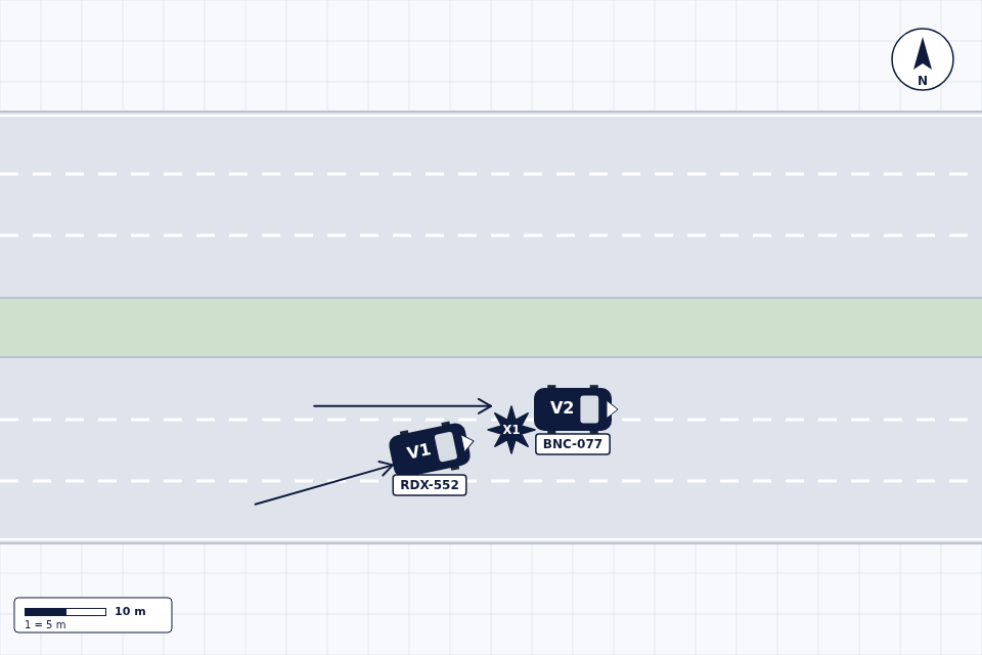
On a divided highway, V1 (RDX-552) drifts from the outer lane toward the inner lane where V2 (BNC-077) is traveling. The vehicles touch side-to-side at X1 as V1 crosses the lane line.
How it was built
- ▸V1 is drawn at a shallow angle across the dashed lane line — in a sideswipe, the angle IS the story. A few degrees is all it takes.
- ▸V1's arrow is diagonal (the lane-change path); V2's is straight (holding its lane). The contrast between the two arrows explains the collision by itself.
- ▸X1 sits between the vehicles' sides, not their ends — impact location on the bodywork distinguishes a sideswipe from a rear-end.
- ▸The median from the highway template shows both vehicles were in the same direction of travel, ruling out a head-on reading at a glance.
What this diagram communicates
Which lane each vehicle was in, that V1 was mid-lane-change at contact, and that the impact was side-to-side.
What it does not prove
Whether V1 signaled, what the mirrors showed and how fast either vehicle was travelling are all outside the drawing. Damage photos of both flanks are the natural companion to this diagram.
Read the full guide: What to include in an accident diagram: a practical checklist →Draw this yourself in the editor →
Traced over a photo of the real location
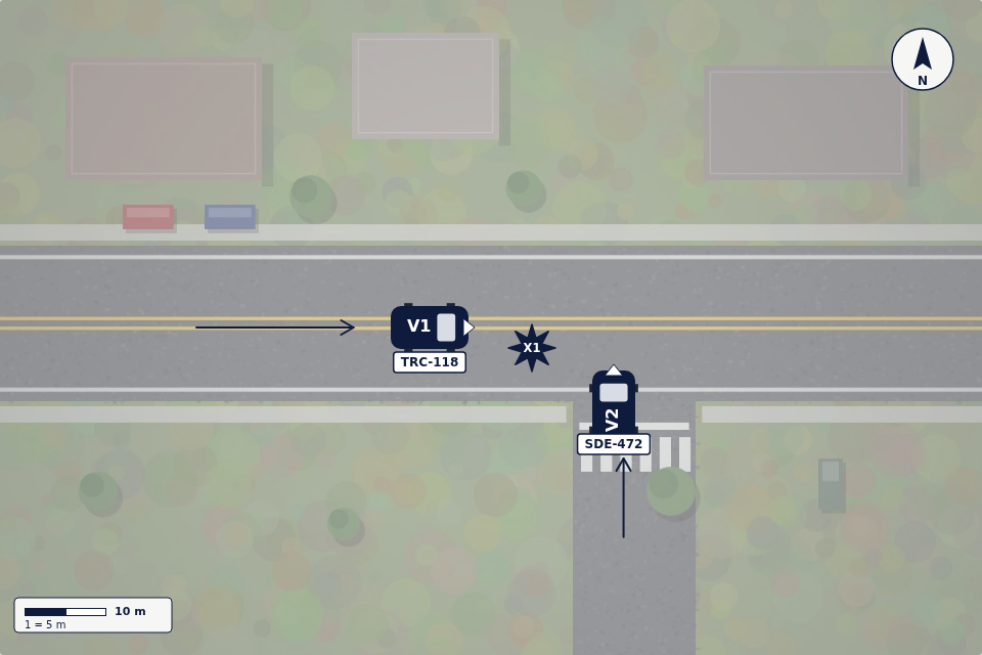
V1 (TRC-118) travels east on a two-lane road. V2 (SDE-472) pulls out of a side street, across the crosswalk, into V1's path; they meet at X1. Instead of a road template, this diagram is drawn on top of an overhead image of the location — the way you would handle a junction no template matches. (The base image here is a sample overhead view, not a real place.)
How it was built
- ▸The image was dropped in through the Scene photo panel and dimmed to 55%, so the drawing stays the brightest thing on the page.
- ▸Nothing was drawn for the roadway: lane widths, the crosswalk, the stop bar, the buildings and the parked cars along the verge all come from the image itself.
- ▸Only four elements sit on top — two vehicles with plates, two travel arrows, one impact point. On a photo, less drawing reads better because the context is already there.
- ▸The compass was set to the real bearing. The photo shows the place; north tells the reader how to orient it.
What this diagram communicates
The true geometry of a location no template covers: real lane widths, the exact position of the crosswalk and side street, and where each vehicle sat within that actual layout.
What it does not prove
Distances eyeballed from an image are not measurements — image scale varies with the source, zoom and camera angle. Measure on the ground with a tape or wheel and record those numbers. The photo gives geometry; the tape gives distance.
Read the full guide: Draw over a photo of the real location: tracing a scene image →Draw this yourself in the editor →
Backing out of an angled parking stall
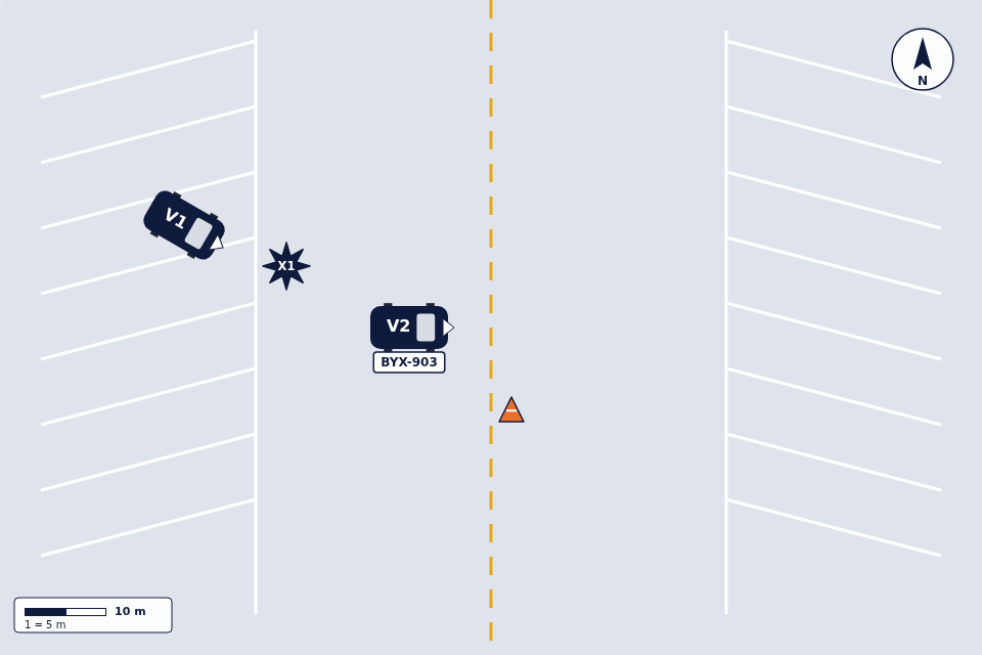
In an angled lot, V1 backs out of a stall while V2 (BYX-903) travels along the aisle. The impact point X1 sits at the stall line — exactly the spot both drivers will disagree about.
How it was built
- ▸The angled stall pattern comes from the parking template — it silently documents which way the aisle flows, because you can only nose into a '/' stall from one side.
- ▸V1 is drawn half-out and rotated: a car mid-maneuver, not one that had already left the stall. Those are different collisions.
- ▸X1 is placed at the stall line, the disputed boundary, rather than on either vehicle.
- ▸The cone marks the fixed obstruction that shaped the sight lines — it belongs in the drawing precisely because it did not move.
What this diagram communicates
The direction of aisle flow, how far out of the stall V1 had come, where V2 was in the aisle, and what limited visibility.
What it does not prove
Speed and who saw whom first fall outside a drawing of this kind. The diagram records geometry; the narrative records what each driver reported.
Read the full guide: Parking lot accident diagram: a worked example →Draw this yourself in the editor →
Draw your own
The editor is free, works in the browser and needs no account. Pick a road template or trace a photo of the real location, and recreate any of the scenes above in a few minutes.
Open the sketch editor