Guide: how to draw a traffic sketch
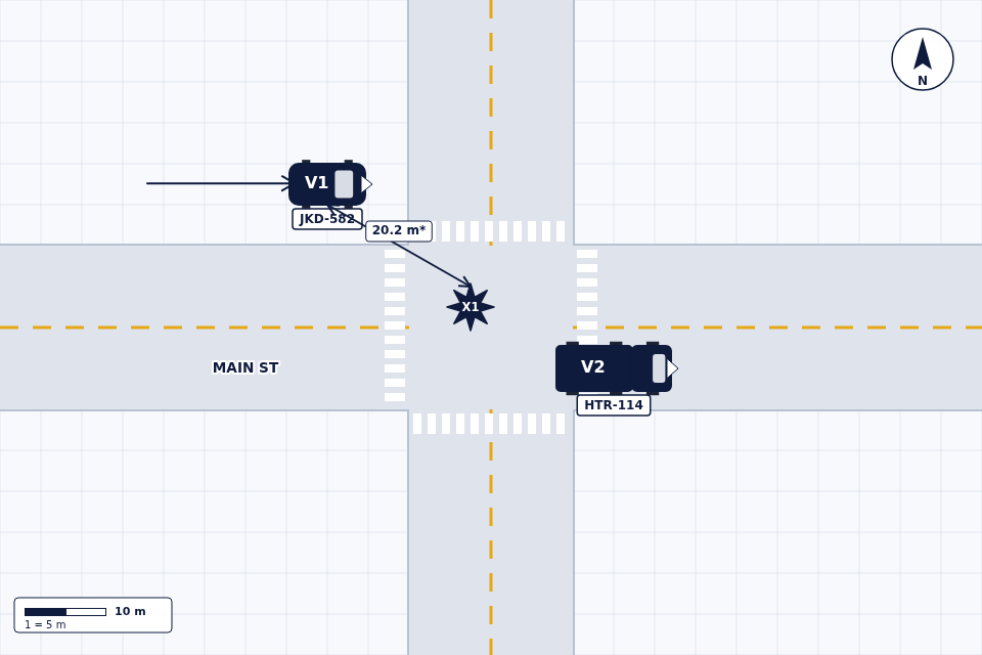
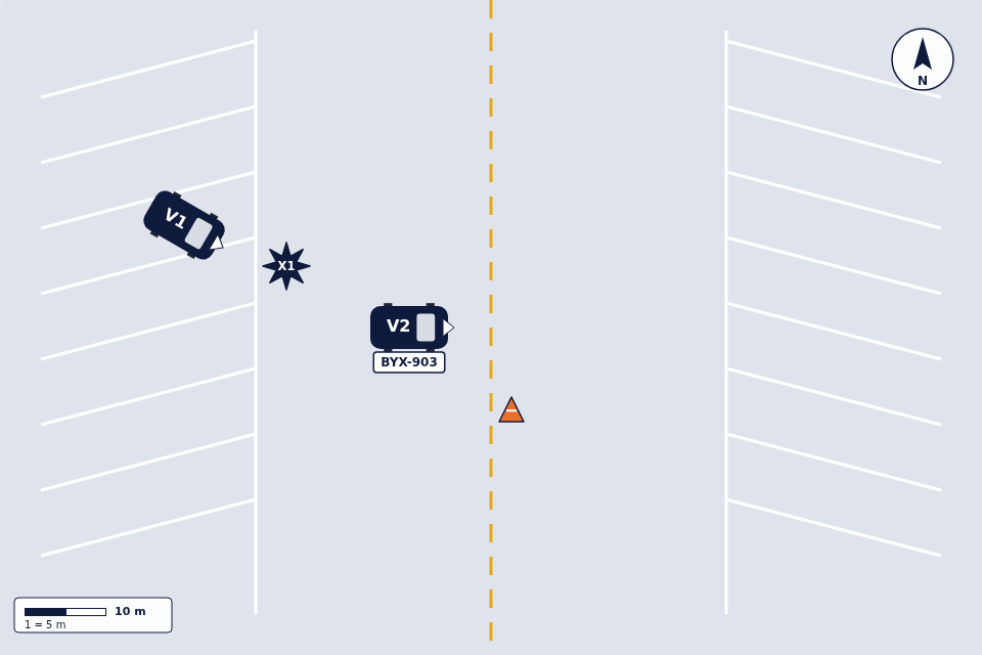
Four steps, free and no account. The examples below were made with this very tool.
Open the tool and start1. Pick the roadway or paste a photo
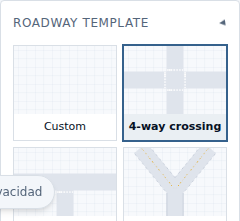
There are three ways to start, and picking the right one decides how much work you save later. The 23 previewed templates cover the ordinary layouts: crossings, T-junctions, roundabouts, turn lanes, parking lots. When the real intersection matches none of them, the road tool lets you trace the map by hand, bend the curves and set each lane width. And when the geometry genuinely matters — an odd-angled crossing, a turn pocket that exists in one direction only — paste a satellite screenshot of the exact location and trace over it: the photo dims behind your drawing, so the finished sketch carries clean lines over the real shape of the road.
2. Place and identify the vehicles
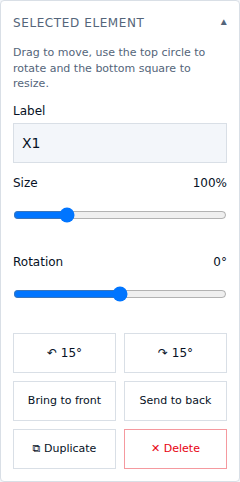
Tap an element in the palette, then tap the canvas to place it. There are cars, trucks, buses, motorcycles, bicycles and pedestrians, plus traffic lights, signs and cones for whatever else was there. Each vehicle numbers itself (V1, V2…) and carries its own plate and description — make, colour, damage area — which later print in a table under the diagram so a reader knows which car is which without guessing. Drag to move, use the top handle to rotate and the bottom one to resize. Place them where they were at the moment of impact, not where they ended up afterwards: that distinction is the one that most often confuses whoever reads the sketch.
3. Arrows, measurements and notes
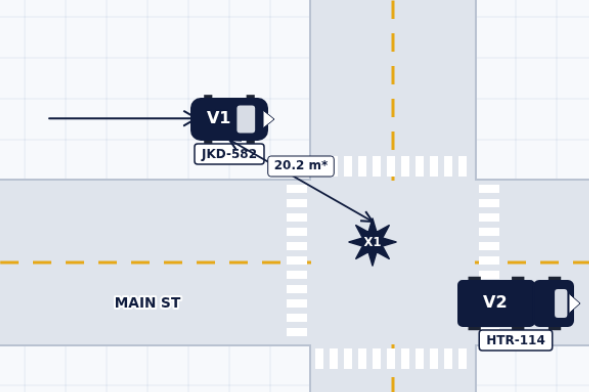
One arrow per vehicle showing where it was heading before the crash: without them, two cars in an intersection tell no story at all. Mark the point of impact with its own symbol, distinct from the vehicles themselves. To measure, first set how many feet or meters each grid square represents and keep that value across the whole drawing; stating the scale matters more than the exact number you pick. Add the street names and a short note where one is needed — a red light, a parked vehicle blocking the view — and leave the rest for the written narrative.
4. Export the report
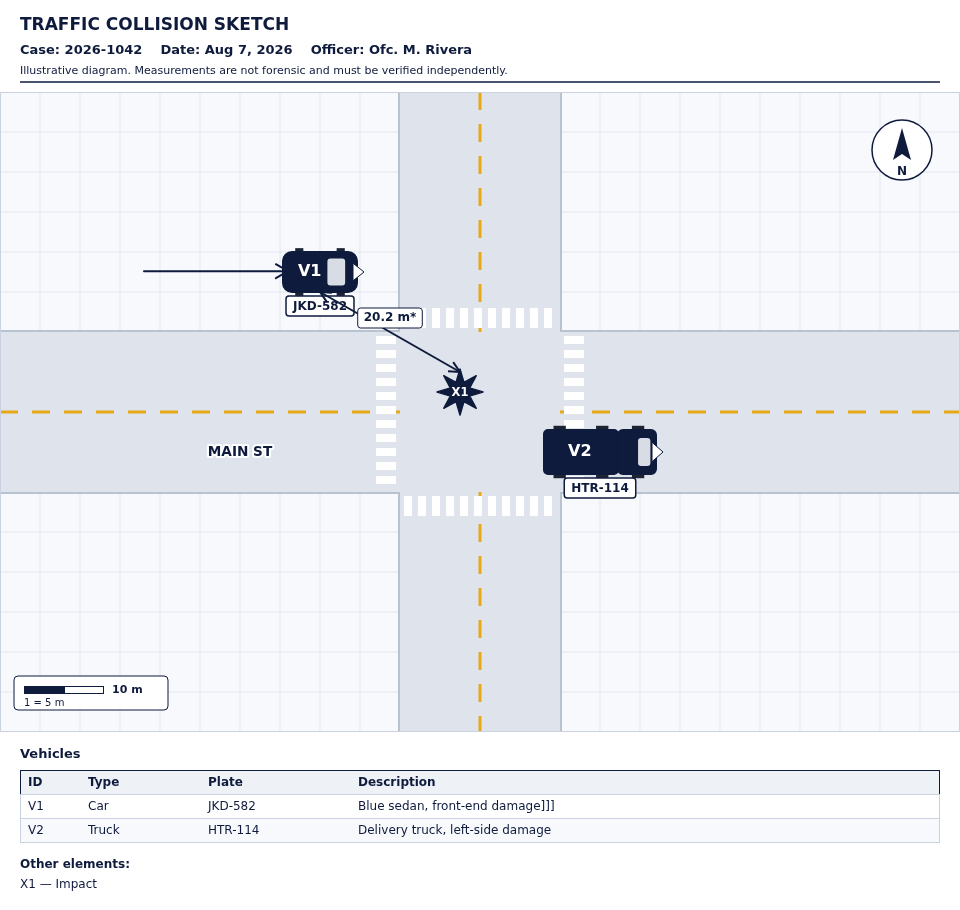
The PDF assembles a header for the case number, date, examiner and scale; a table of the vehicles with their plates and descriptions; your narrative underneath; and a legend of the symbols. It reads as a document rather than a screenshot, which is what makes the difference when it lands in a file next to paperwork from people who do this daily. You can also export a PNG if you only need the image. Every export carries a line stating the diagram is illustrative and its measurements are not forensic: that is deliberate, because an honest sketch is worth more than one that overstates what it proves.
Before you draw: what to note at the scene
The sketch itself gets drawn later, calmly. What cannot be recovered later is what was in front of you that day. If you are still at the location — and only once it is safe to be — these are the details that are hardest to reconstruct from memory a week afterwards.
- Which lane each vehicle was in, and which way it was heading. This is the first detail the two drivers end up contradicting.
- One or two real distances, measured or paced out: from the point of impact to the stop line, from the kerb to the vehicle. One distance you actually took beats ten you eyeballed.
- What controlled the junction and what state it was in: signal, stop, yield, nothing at all. Note who else saw it too.
- What blocked the view — a parked truck, a hedge, a skip — and from which position. That disappears from the scene within hours.
- Wide photos that include fixed reference points: poles, signs, driveways. They are what later lets you anchor the sketch to the real location.
People first, always: attending to anyone hurt, making the scene safe and calling whoever needs calling all come before any documentation. And remember that a sketch records geometry, not blame — who was at fault is settled by the narrative, the statements and the official report, not by the drawing.
Examples made with the tool